Total
The TOTAL chart is simple: it shows a quick overview of the entire period you have chosen with the sliders. The person in the example below was yellow a large part of the selected weeks, and a large part green.
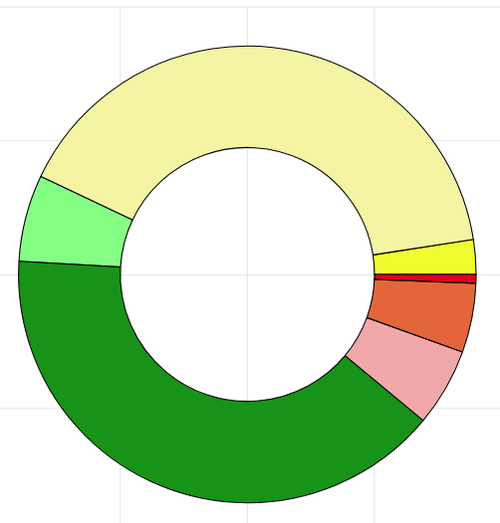
The TOTAL chart is simple: it shows a quick overview of the entire period you have chosen with the sliders. The person in the example below was yellow a large part of the selected weeks, and a large part green.

+31-(0)85-1309271
KvK: 62602497
BTW: 854883265B01