Ratios
The chart 'RATIOS' also shows your scores on the rainbow day by day, but blocks of the same color are grouped together. Yellow is always on the left at RATIOS; red on the right. You can see which part of a day every color took.
In this example of a day, in this case 22 January (the date is on the left of each bar), nearly 50% of the recorded time was green (good), 4% of the part of the day on which the registration is very dyskinetic (dark red ).

Note: the time plays no role in this card, other than in SCORES. If you want to know when you were 'yellow', you need the SCORES card. If you want to know how much you were 'yellow' then RATIOS or OVERVIEW is ideal.
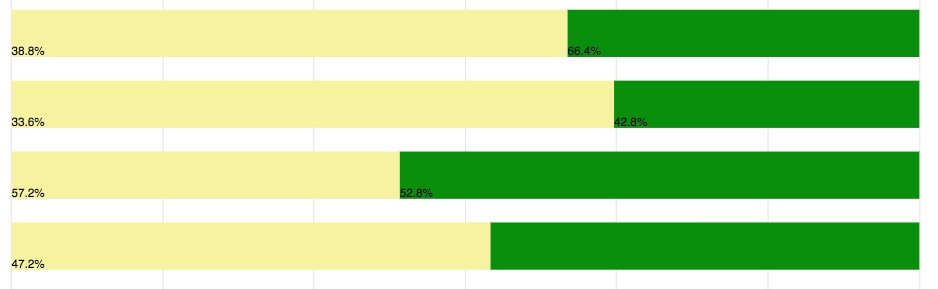
This is an example RATIOS of another person, of 4 days, each line is a day.